
KPI definitions
Every metric in Analytics counts something specific. This page explains numerator and denominator for each, how in-progress calls are treated, and how fresh numbers are. One rule: a metric shows X / Y, not a vague impression.
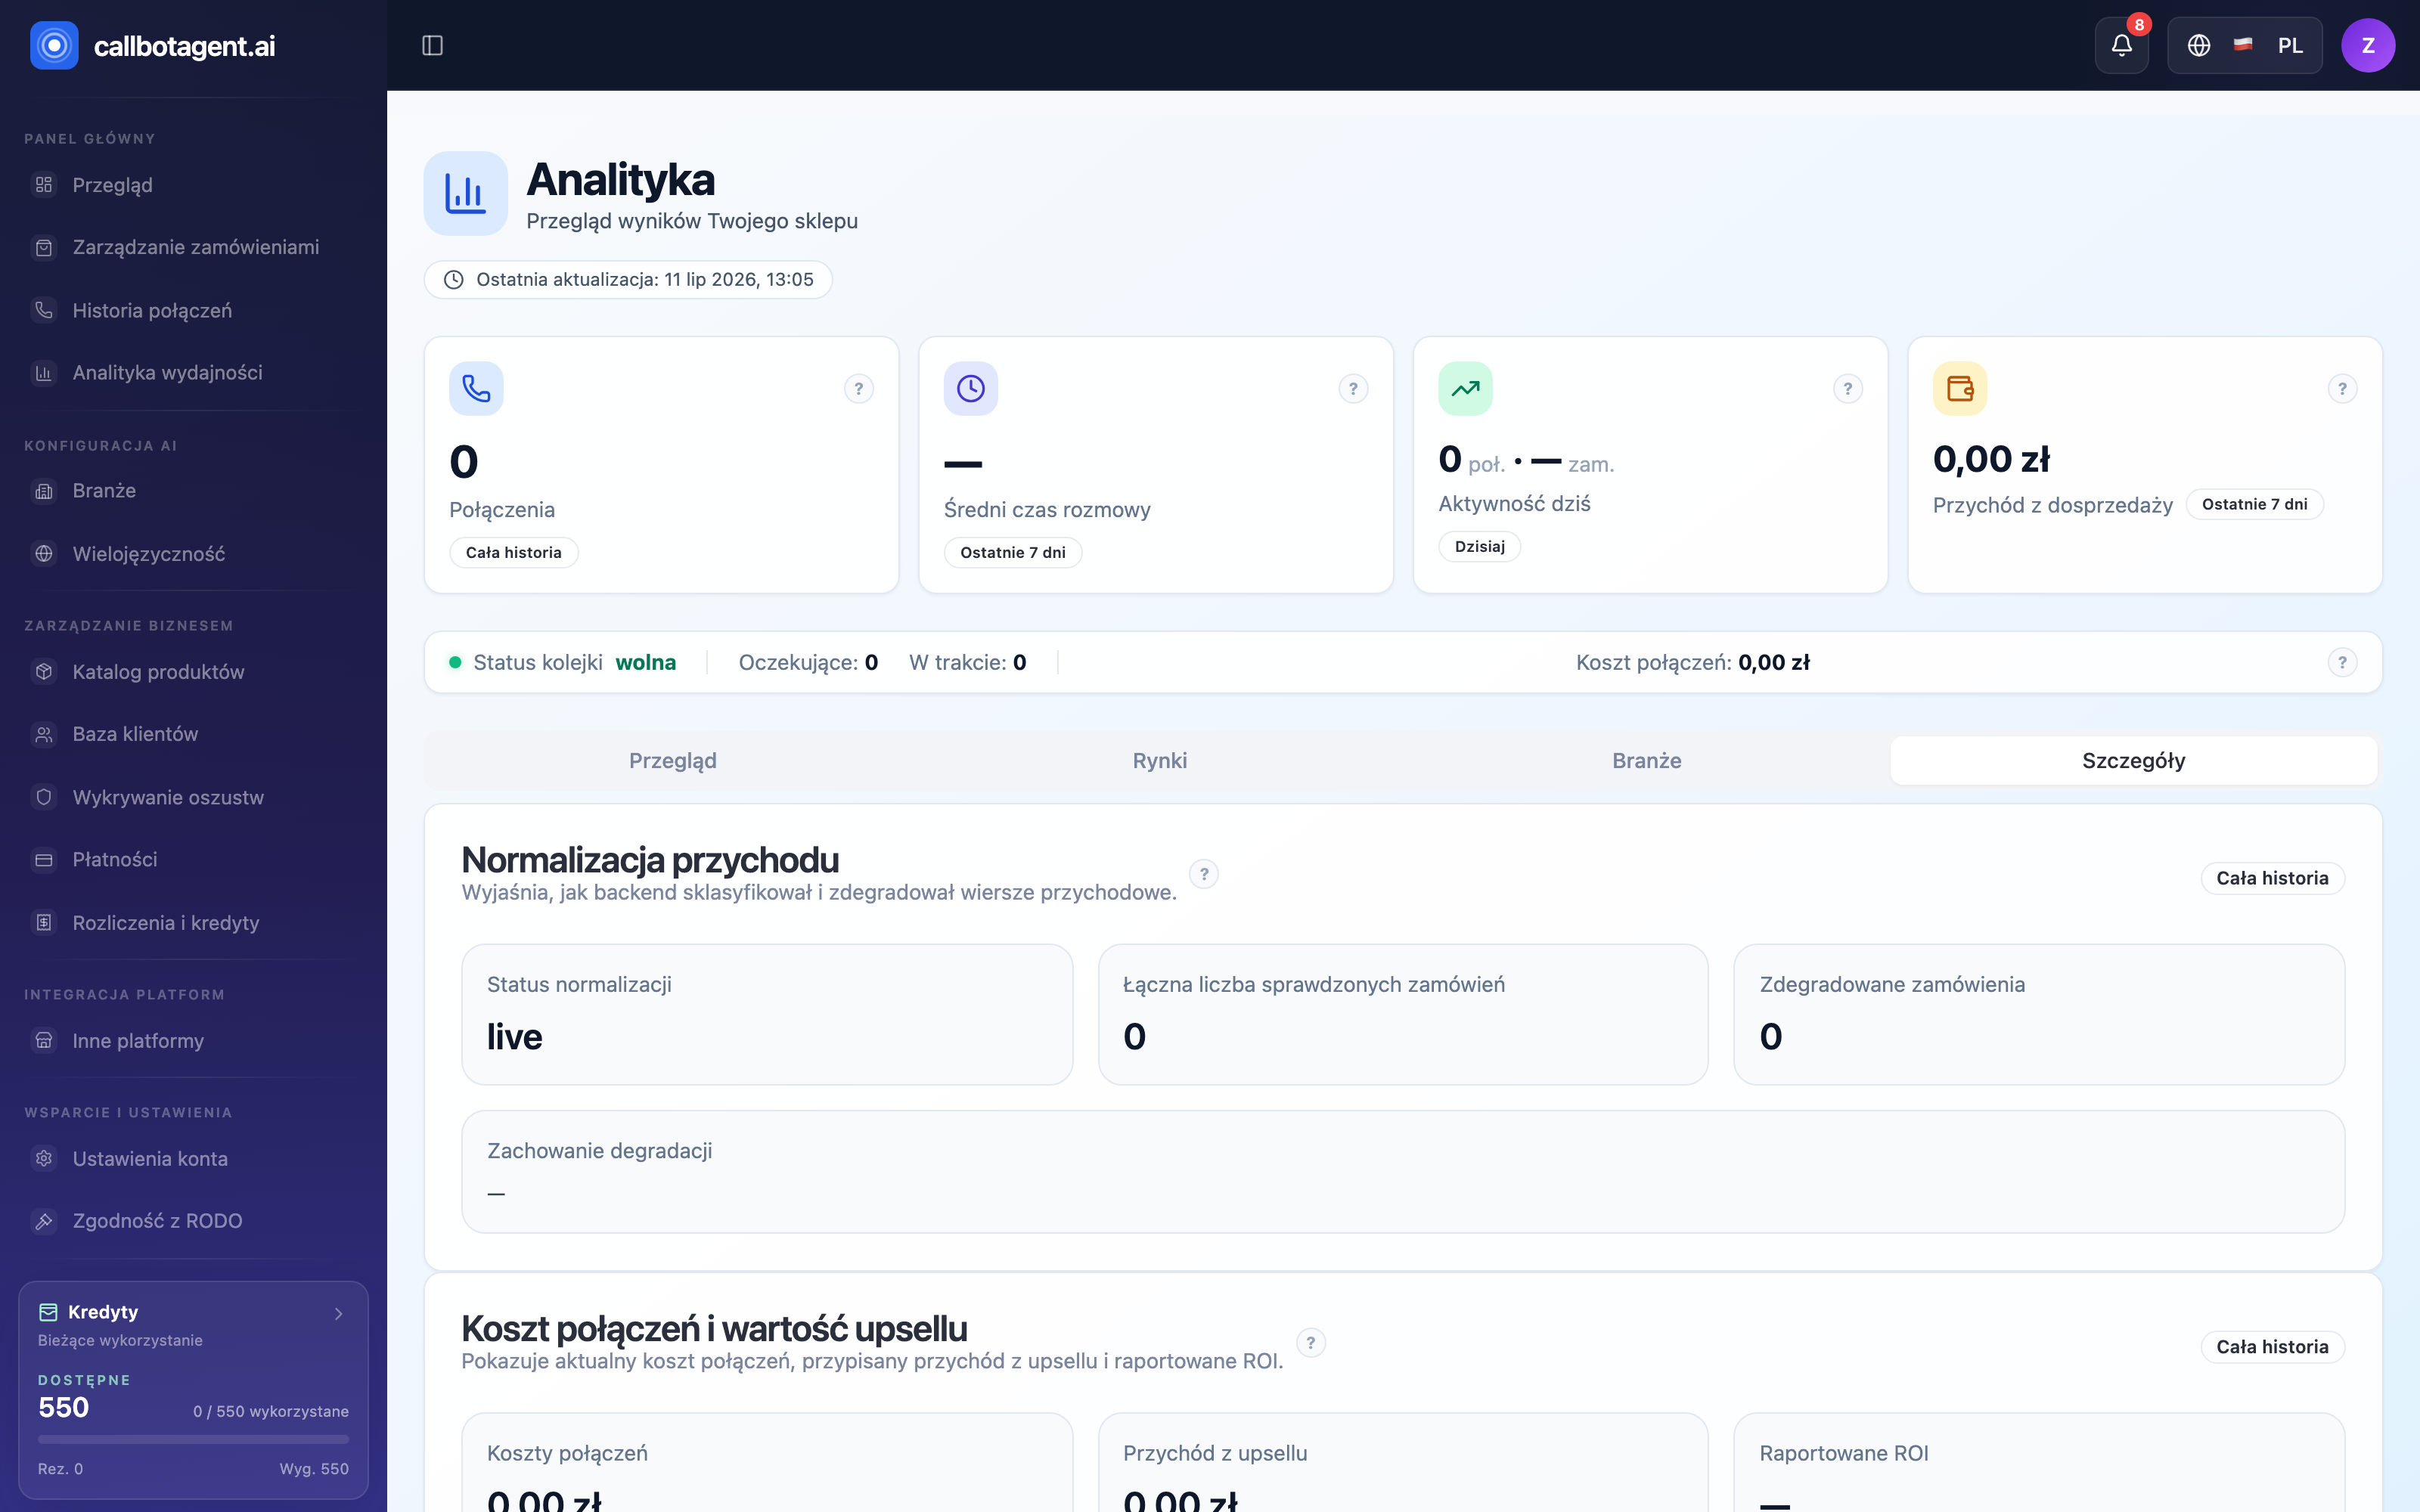 Analytics with Details tab active: KPI tiles (Calls, Average call duration, Activity today, Upsell revenue), queue status bar, and "Revenue normalization" and "Call cost and upsell value" sections. Sample data (demo).
Four analytics tabs
Above the tabs, filters (period, market, payment method) control which data slice metrics use. Last updated and Queue status appear there too. Below, four tabs:
- Overview — store-wide KPIs, call and order trend, key numbers in one place.
- Markets — same results by market/country: order count, success rate, revenue, and upsell metric for top markets.
- Industries — results by industry with upsell benchmark to compare with similar stores.
- Details — how the system classifies and normalizes revenue ("Revenue normalization") and call cost and ROI ("Call cost and upsell value" with reported ROI).
Markets and Industries fill when completed orders exist in the selected period — until then they show a message that ranking appears when data arrives.
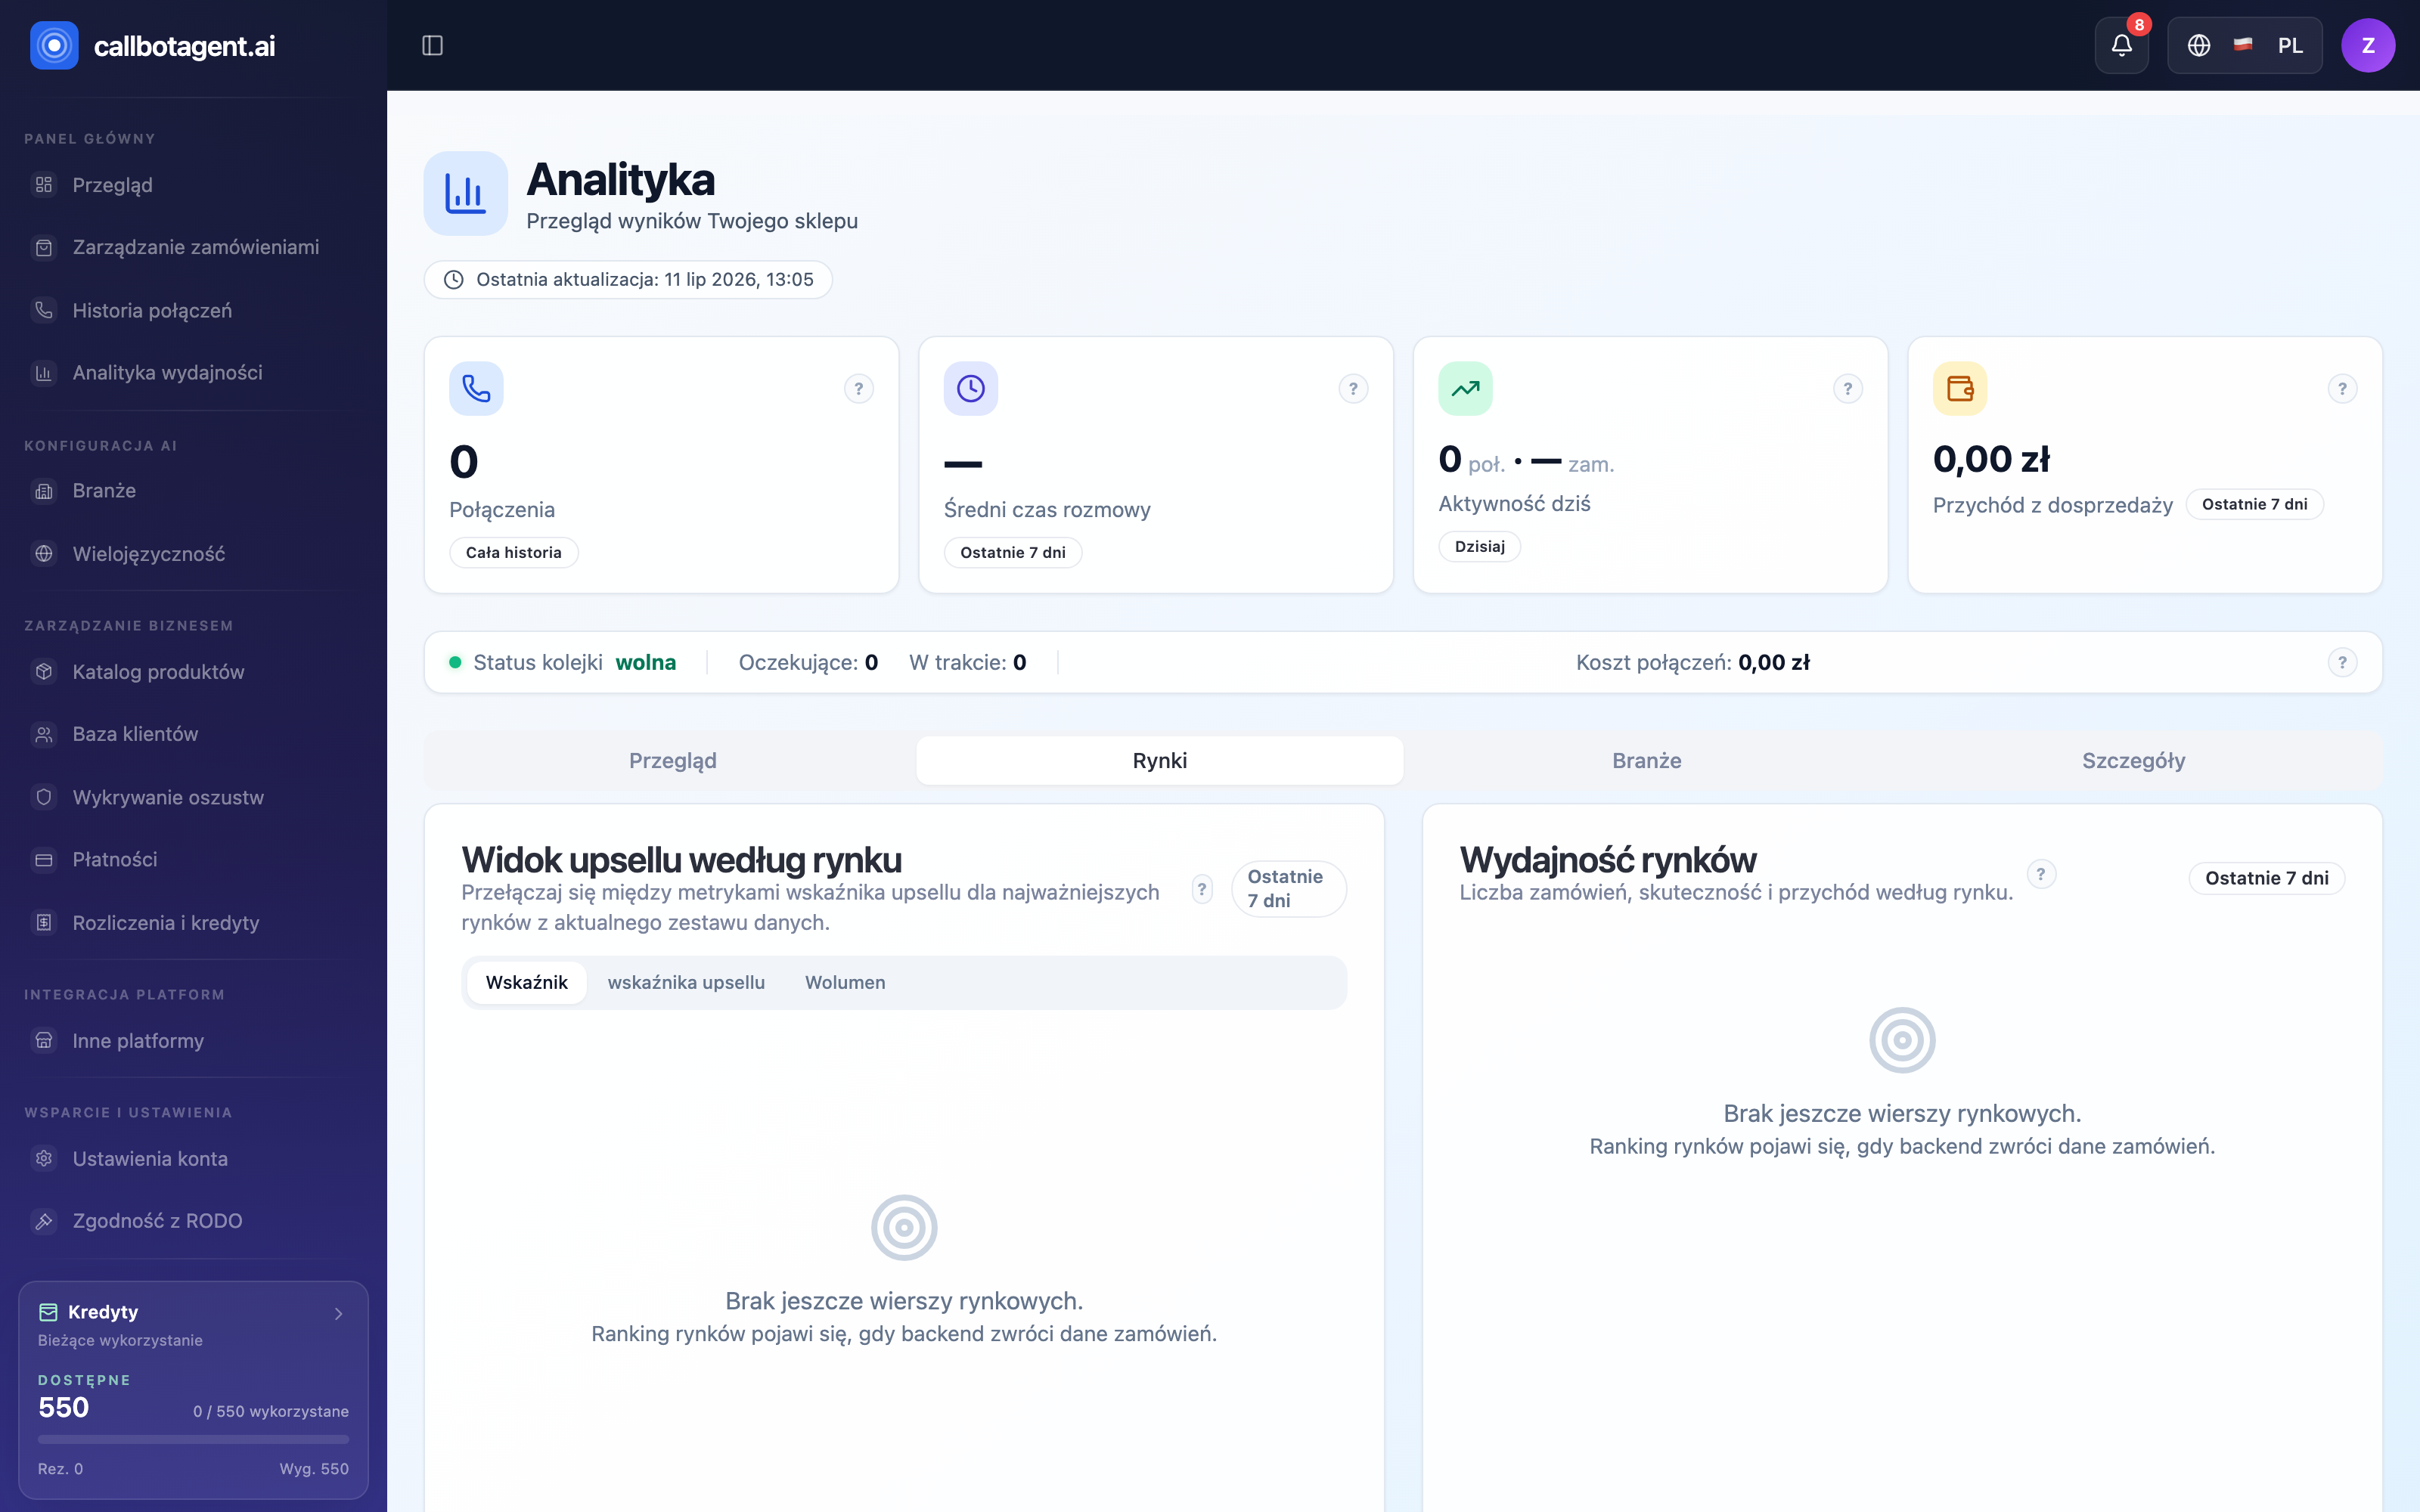 Markets tab: "Upsell view by market" and "Market performance" with order count, success rate, and revenue per market. Sample data (demo).
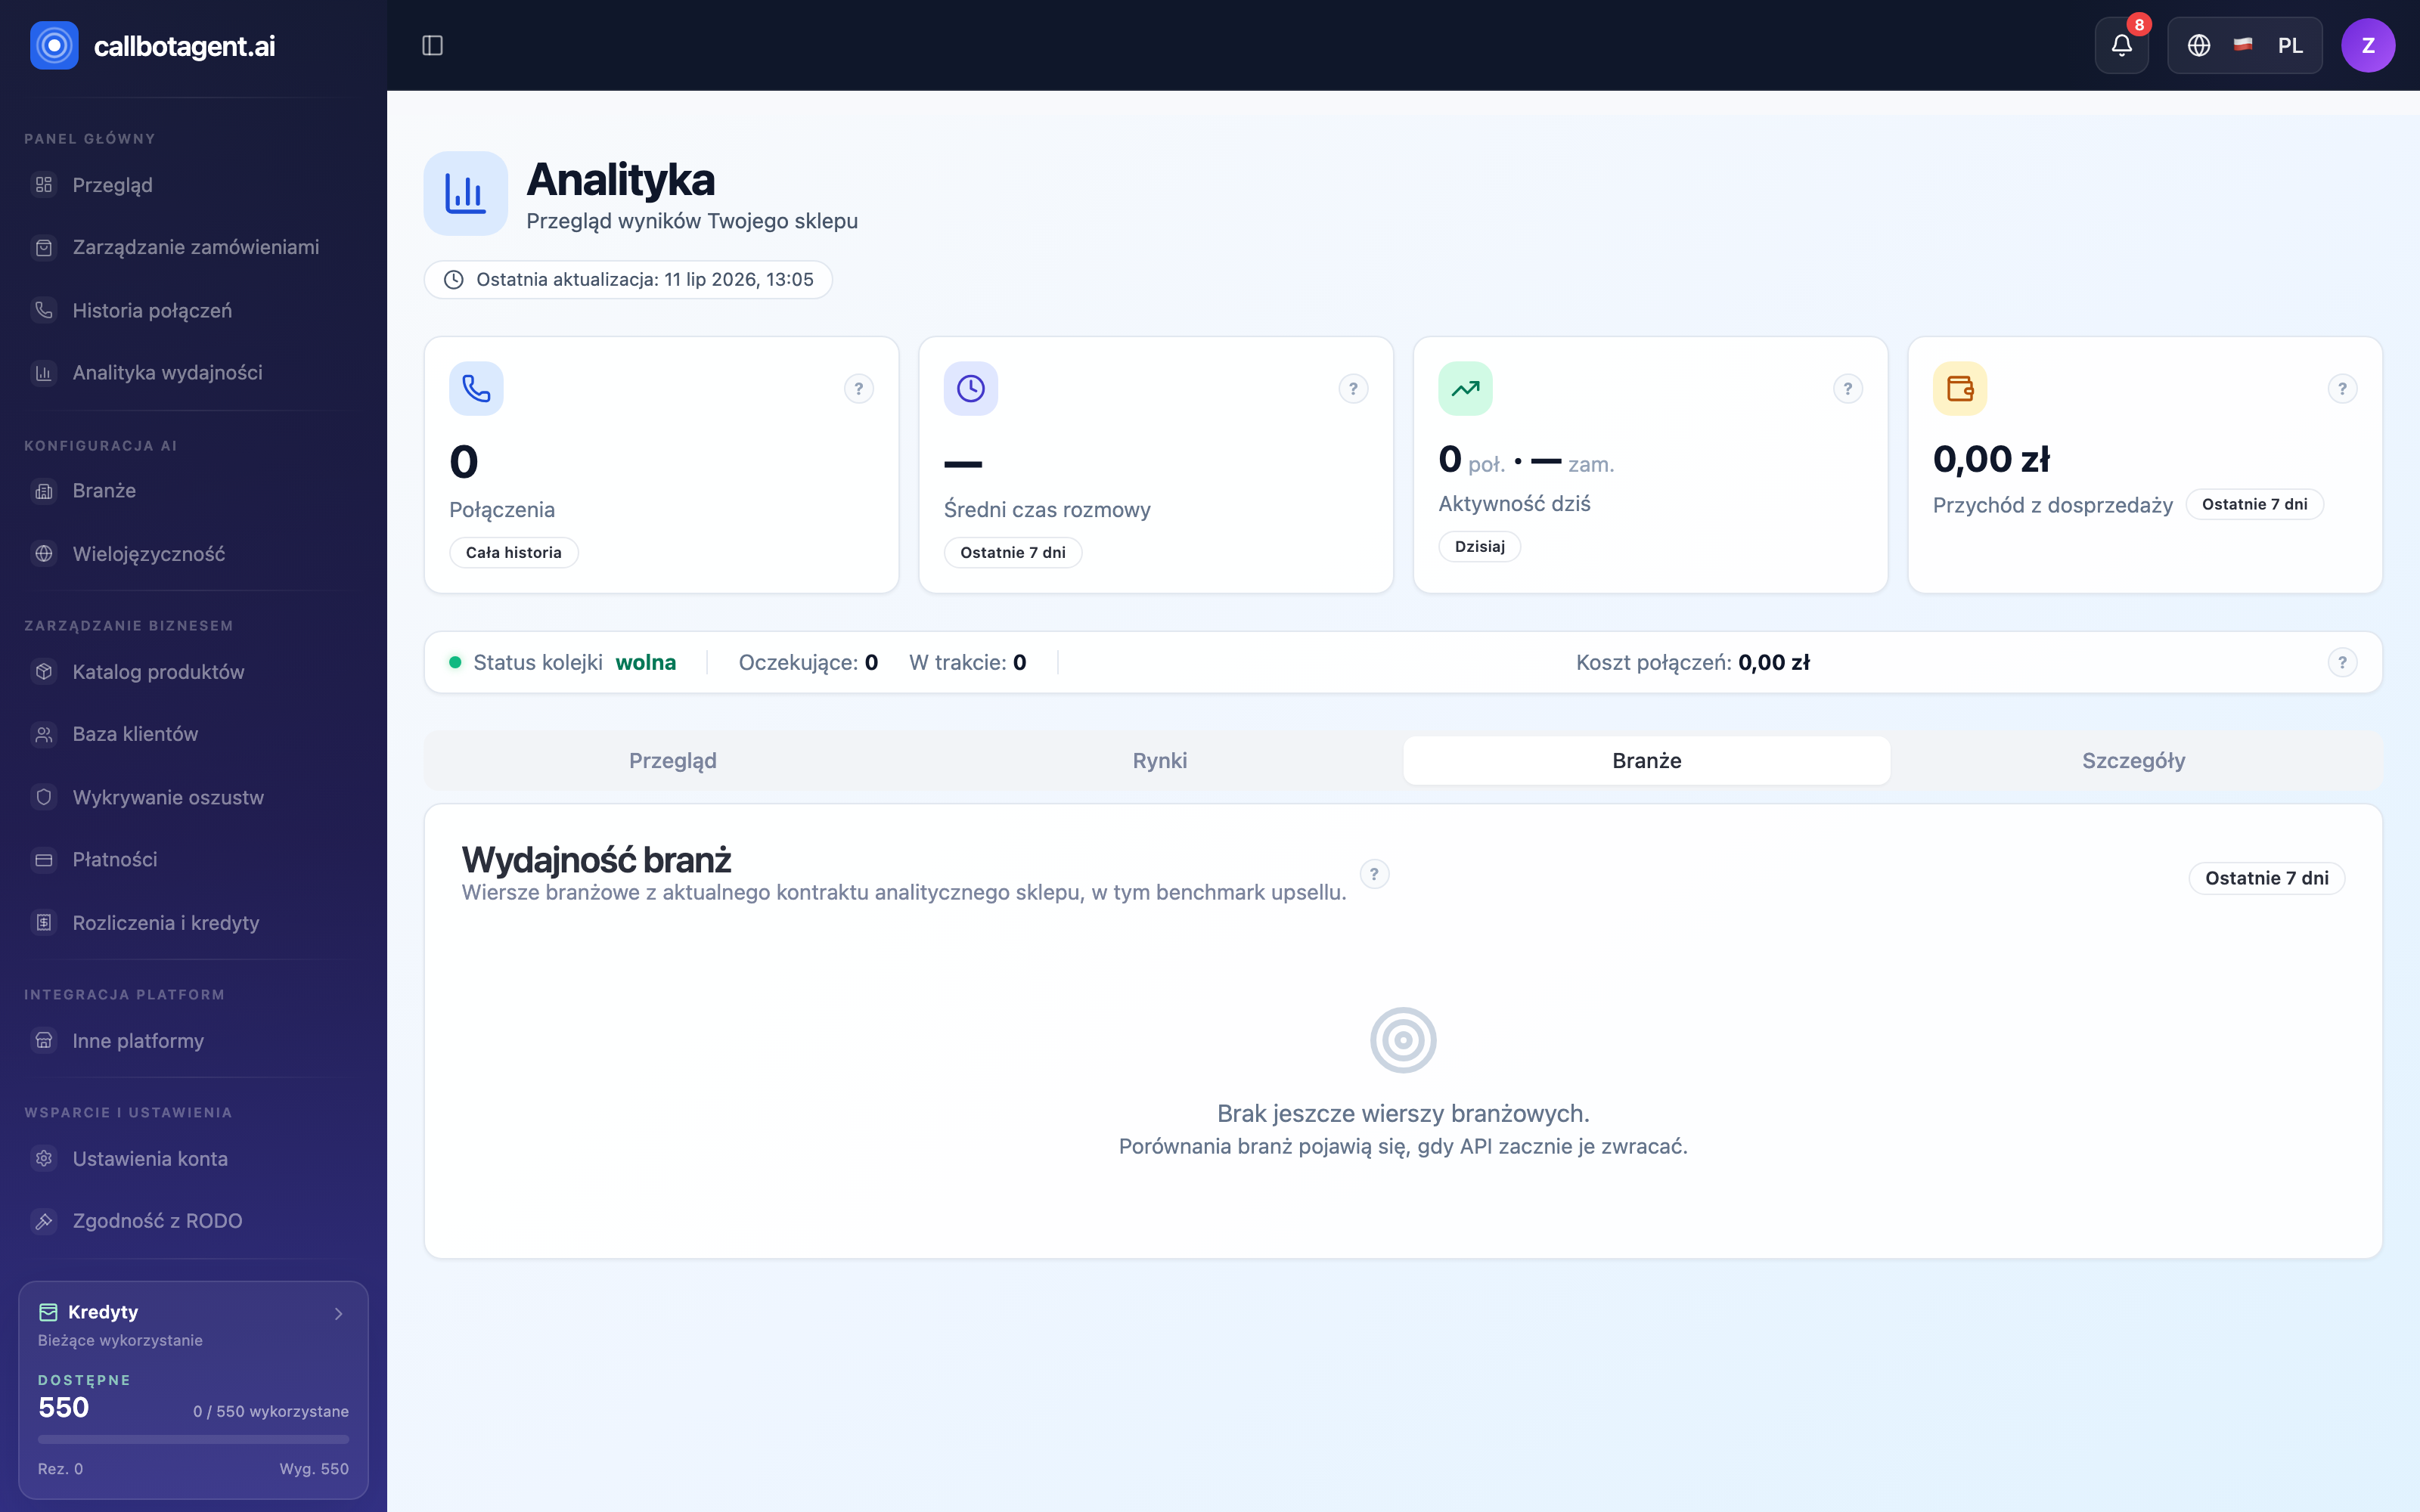 Industries tab: "Industry performance" — comparison and upsell benchmark by industry. Sample data (demo).
Metric glossary
| Metric | What it counts (X / Y) | Unit |
|---|---|---|
| Total calls | all calls in current dataset | count |
| Success rate | calls ending with order placement / all calls | % (0–100) |
| Completion rate | calls brought to conversation end / all attempts | % |
| Average call duration | total handled call time / number of handled calls | time (mm:ss) |
| Upsell rate | orders with accepted upsell / all orders in window | % |
| Upsell revenue | sum of accepted upsell and cross-sell value | amount |
| ROI | (upsell revenue − call costs) / call costs | % |
| Activity today | calls and orders since midnight + change vs yesterday | count / % |
Success rate and completion rate are not the same. Success measures business effect (order created); completion measures whether conversation happened. A call can complete without an order.
In-progress calls
Calls in progress or waiting appear in Queue status ("waiting" and "in progress"). They are not yet in outcome metrics — success rate, upsell rate, average duration — because those need a finished call with a result. They enter KPIs only after the attempt closes. Right after launch success rate may look low because calls are still running.
Time windows
- All history — total calls card sums everything in the dataset regardless of range filter.
- Selected range — most metrics (success, upsell, ROI, average duration) use the range filter at the top.
- Today — "Activity today" counts from midnight in your store time zone and compares to the same window yesterday.
Data freshness
Data is not computed live on every click — the panel uses periodically recomputed snapshots and shows Last updated. Refresh runs automatically every few minutes. If the last refresh failed you see the previous snapshot with a clear notice that data may be slightly older.
Why numbers differ across screens
A dashboard metric may differ from the order list or CSV export. Common reasons:
- Different time window — dashboard uses selected range; order list has its own filter.
- In-progress calls — queue counts them; outcome metrics do not yet.
- Refresh timing — export uses current snapshot; KPIs may be a few minutes older.
- Currency — reporting amounts normalize to one currency; see Details → Revenue normalization.