
Analytics — overview
The Analytics module (Panel → Analytics) is one screen showing how your bot
performs: call volume, success rate, and revenue around those calls. It reflects
real data from your store — no inflated promises. Missing metrics show — instead
of invented numbers.
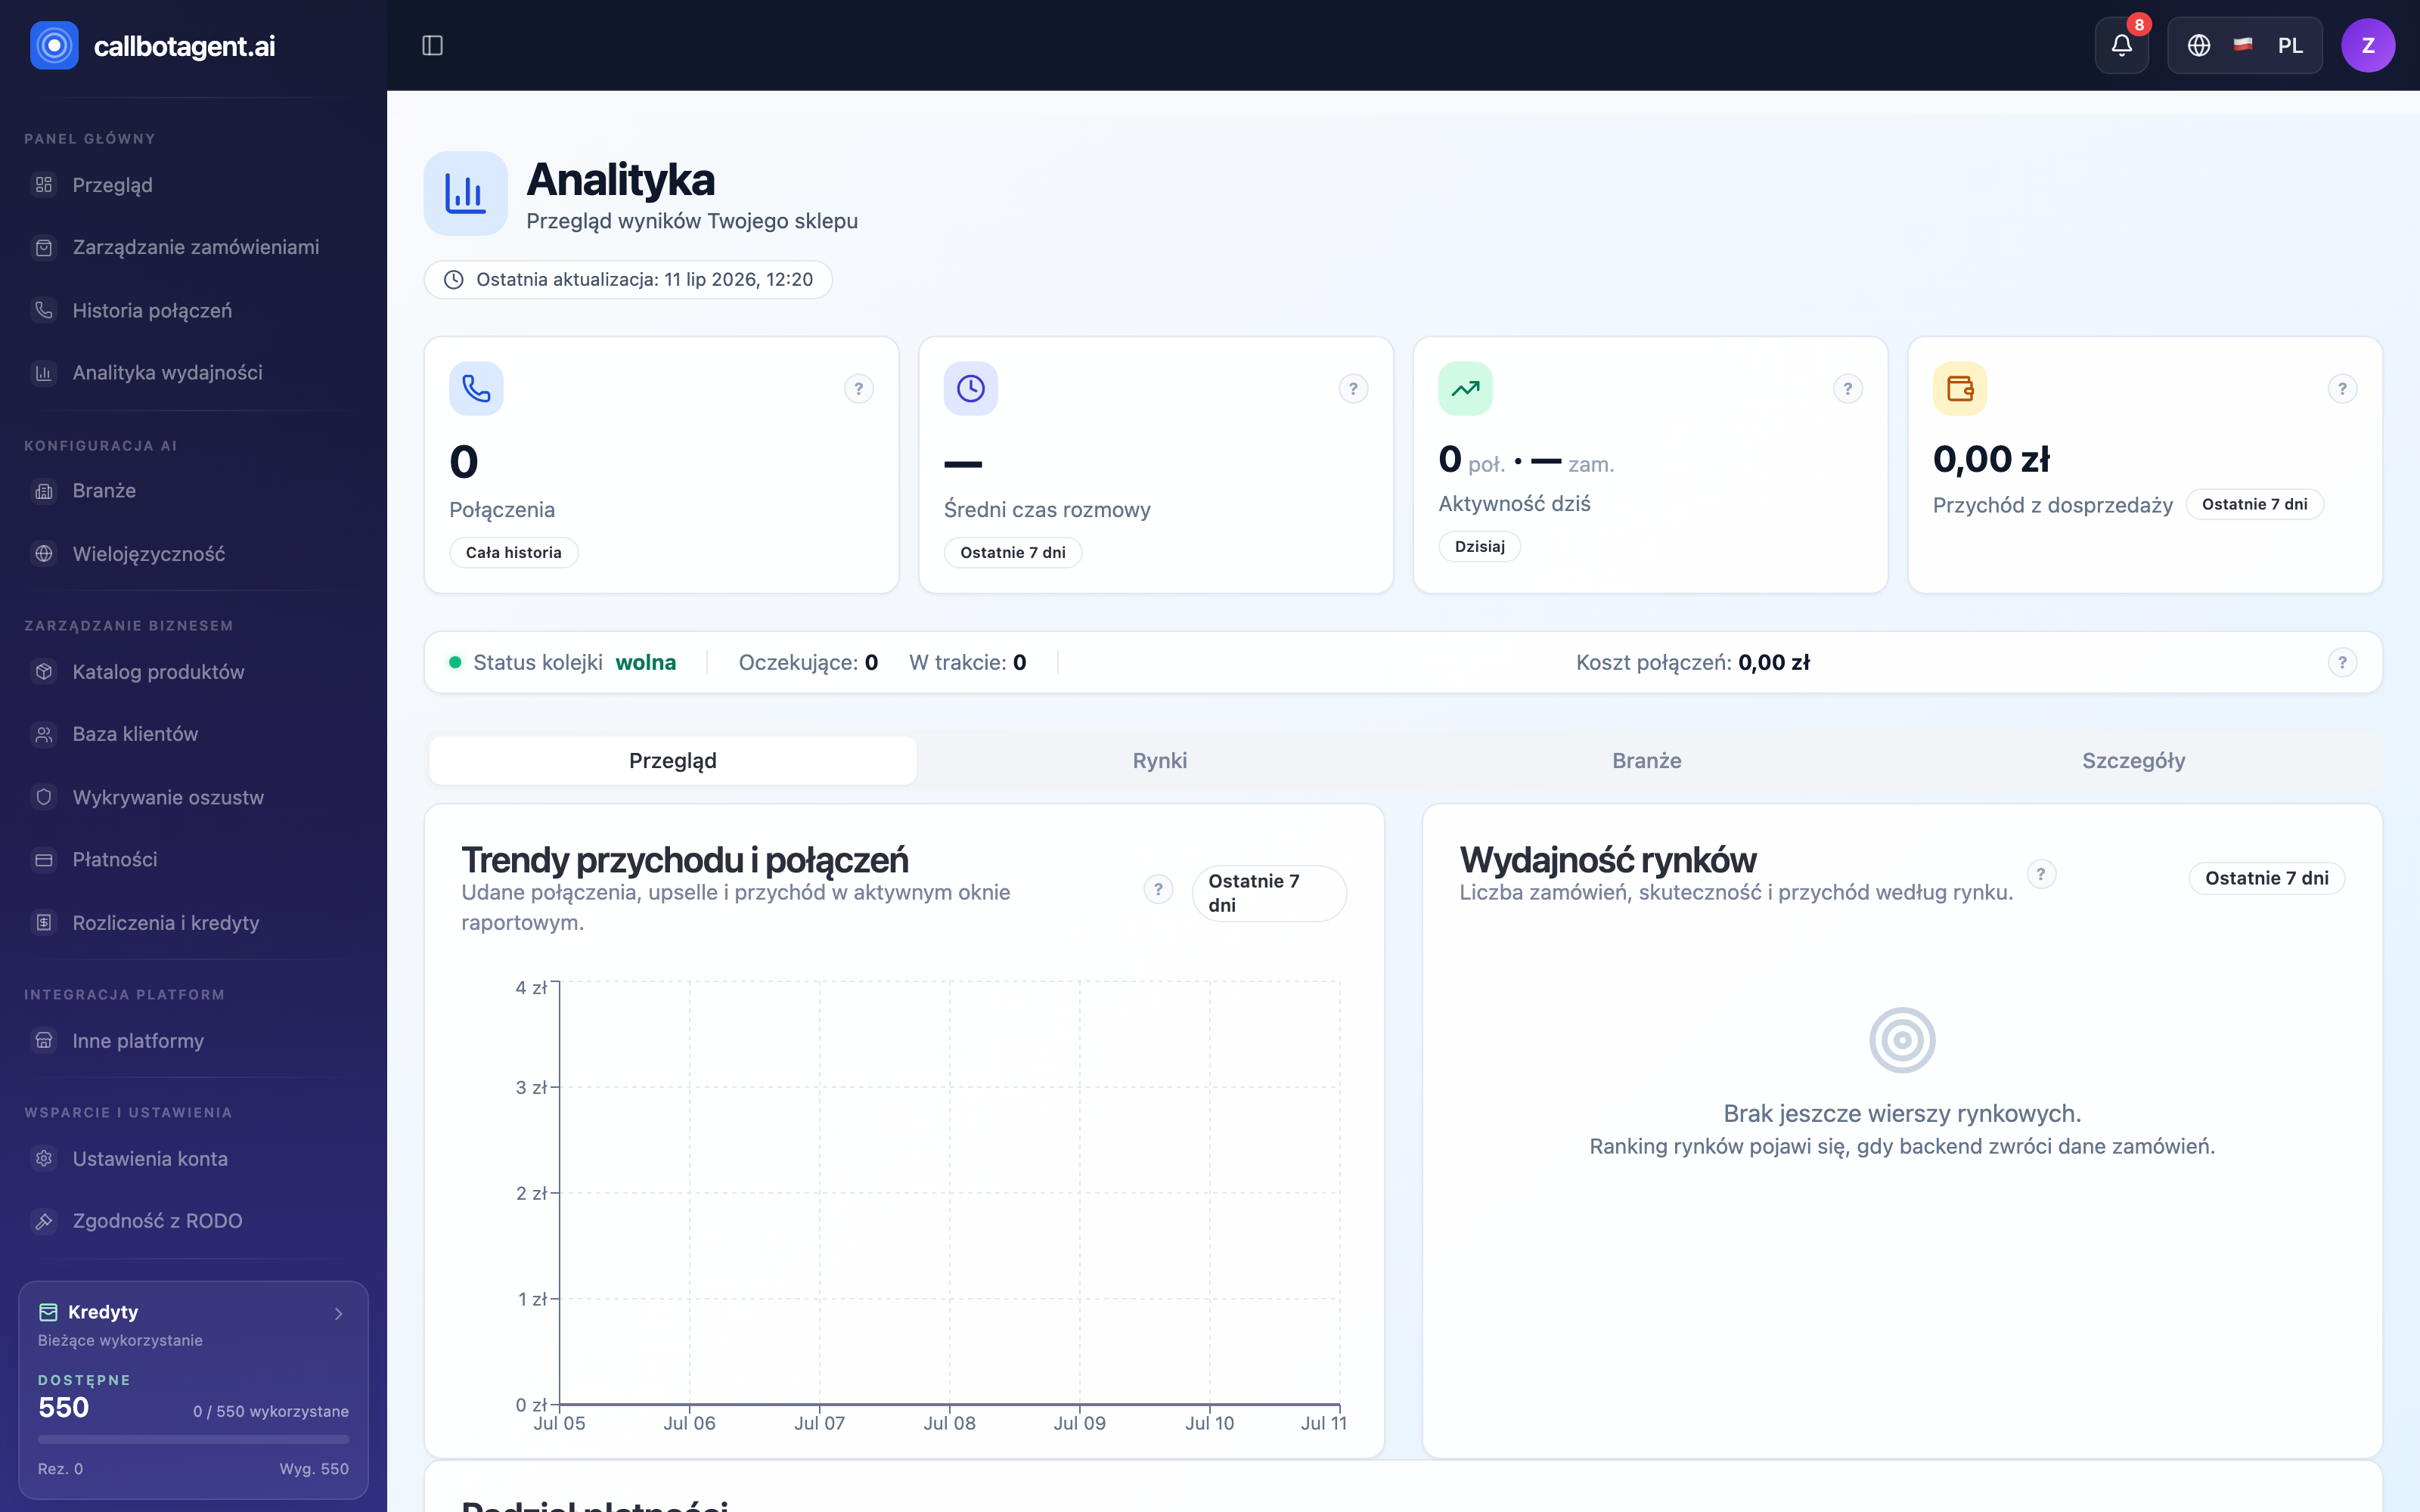 Analytics module: KPIs, tabs (Overview / Markets / Industries / Details) and trend charts. Sample data (demo).
What you see at the top
Above the tabs: KPI cards and queue status bar:
| Card | What it shows | Time window |
|---|---|---|
| Total calls | all calls in current dataset | all history |
| Average call duration | mean length of handled conversations | selected range |
| Activity today | today's calls and orders plus change vs yesterday | today |
| Upsell revenue / ROI | revenue from accepted upsell and return on investment | selected range |
| Queue status | waiting, in progress, completed, failed today | now |
Exact definitions — numerator and denominator for each metric — are in KPI definitions.
Tabs
Below KPI cards, four tabs:
- Overview — trend chart (calls, upsell, revenue over time) and top markets summary.
- Markets — market ranking with order count, success rate, and revenue; switch between metric, revenue, and volume views.
- Industries — performance by store category.
- Details — revenue normalization (currency conversion) and call cost vs ROI.
Filters and export
Filters narrow the whole screen at once:
| Filter | Values |
|---|---|
| Time range | last 7 / 30 / 90 days, all history, or custom dates |
| Market | all markets or single country |
| Payment type | all, prepaid, cash on delivery |
Filter state is in the URL — bookmark or share the link. When export is enabled, Export CSV downloads data matching current filters.
Filters, export, and drill-down depend on your plan. Basic plans show the KPI layer; full filtering and export unlock on higher plans (see Plans, subscriptions, invoices).
Data freshness and currencies
Last updated appears above the screen. The panel refreshes every few minutes; if refresh fails you see the last snapshot with a notice. Amounts use your store display currency; cross-market comparisons use one reporting currency (details in Details → Revenue normalization).